


A lot of folks that we work with love specific areas of town and we have honed in on market data for it all. The variation in these neighborhoods are vast when you consider average yard size, age of homes, style of architecture, types of parks, general vibe while walking around, etc. Here’s the overall real estate data from 2023 (with the percent of change compared to ‘22!) so that you can add in some new variables to consider if you’re looking to make a move. Let us know if you want super detailed sold data!
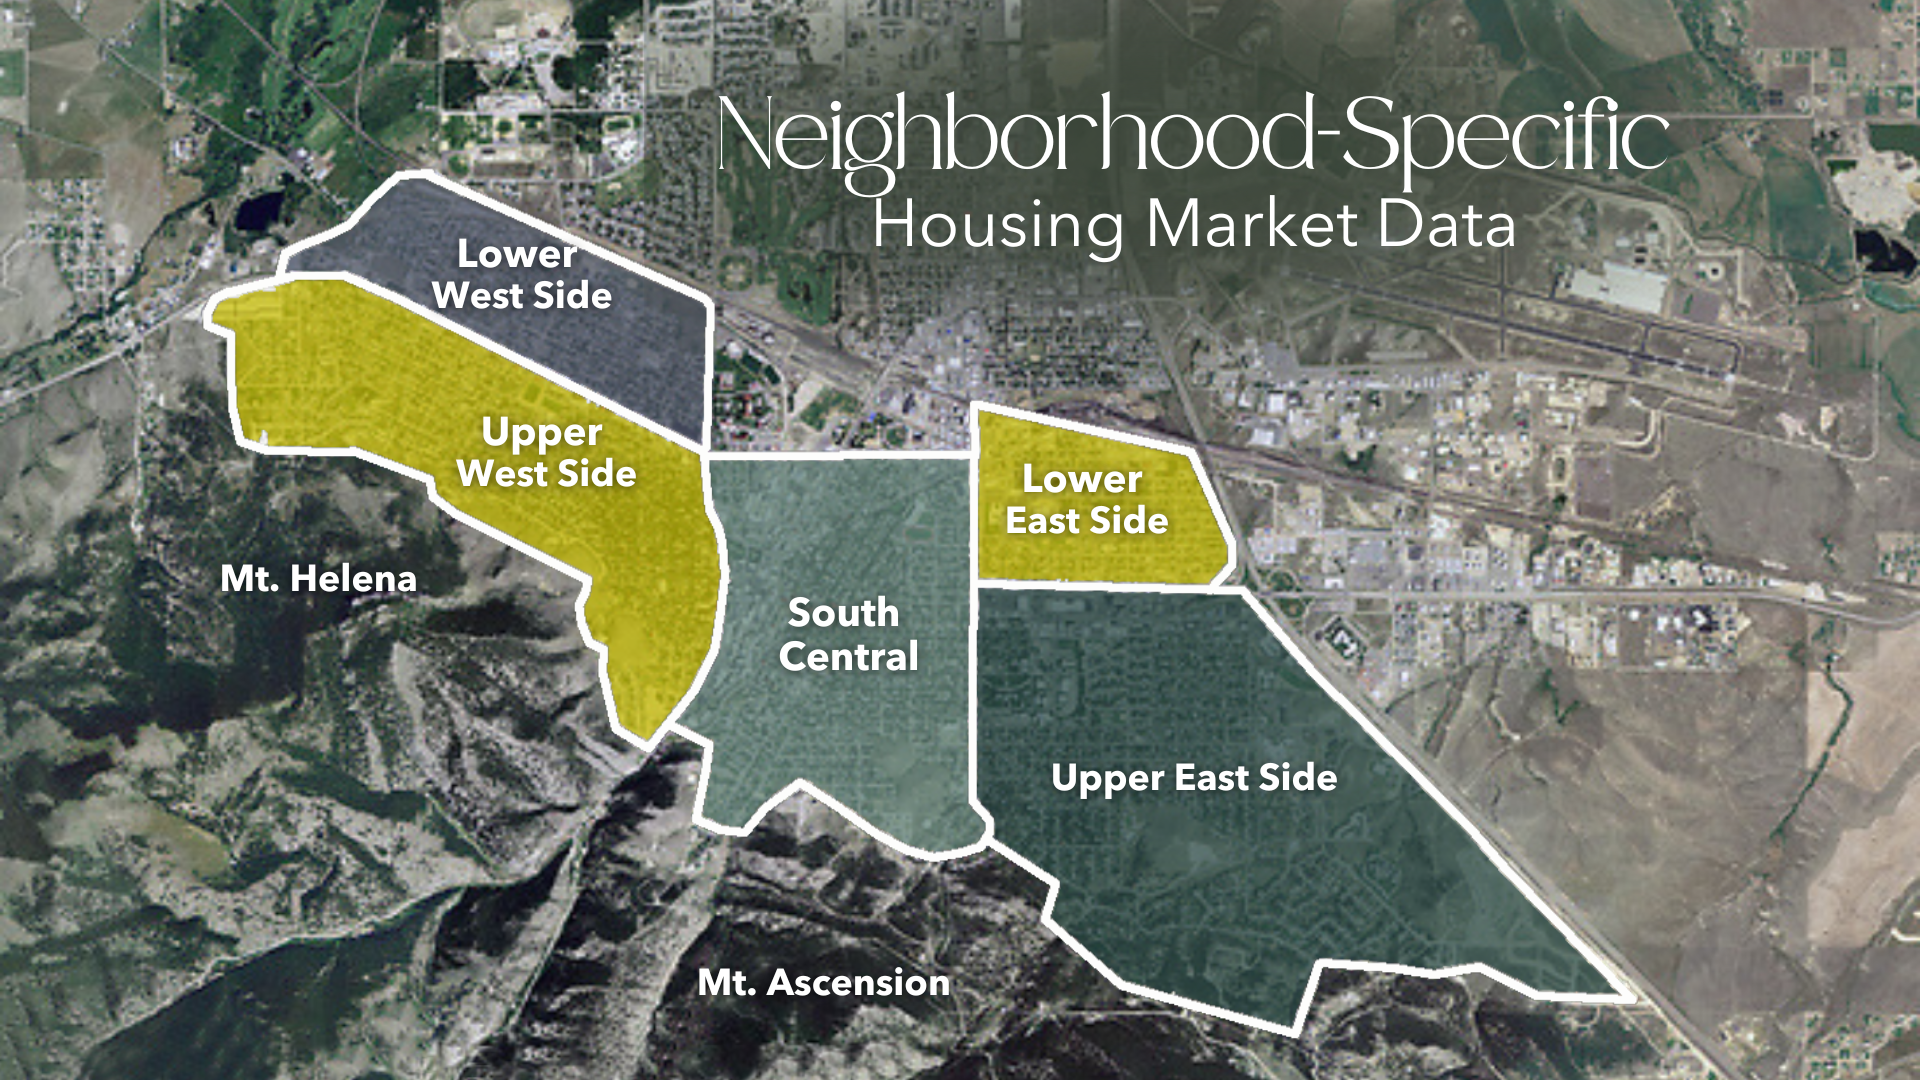
Upper West Side
Median Sales Price: $516,500 ⬆️ 12.9%
Number of Sold Homes: 44 ⬆️ 15.8%
Lower West Side
Median Sales Price: $358,280 ⬆️ 0.9%
Number of Sold Homes: 27 ⬇️ 3.6%
South Central
Median Sales Price: $385,000 ⬇️ 6.5%
Number of Sold Homes: 41 ⬇️ 32.8%
Upper East Side
Median Sales Price: $444,000 ⬆️ 12.9%
Number of Sold Homes: 44 ⬆️ 15.8%
Lower East Side
Median Sales Price: $332,500 ⬆️ 7.1%
Number of Sold Homes: 26 ⬆️ 30%
All data provided by the Montana Regional MLS is related to residential single family homes.
